爱客仕-前端团队博客园

performance知多少

window.performance是对页面性能检测非常有用的api,今天来介绍最常用几个功能。

判断用户访问的页面的方式

其中type的值,为0表示正常访问,比如点击,1表示刷新,2表示回退、前进

1
2
3
performance.navigation;
// {type: 2, redirectCount: 0}

统计当前文档的加载速度

1
2
3
4
5
6
7
8
9
10
11
12
13
14
15
16
17
18
19
20
21
22
23
24
25
26
JSON.stringify(performance.timing)
{
// "navigationStart": 1489591870951,
// "unloadEventStart": 0,
// "unloadEventEnd": 0,
// "redirectStart": 0,
// "redirectEnd": 0,
// "fetchStart": 1489591871159,
// "domainLookupStart": 1489591871159,
// "domainLookupEnd": 1489591871159,
// "connectStart": 1489591871159,
// "connectEnd": 1489591871159,
// "secureConnectionStart": 0,
// "requestStart": 1489591871162,
// "responseStart": 1489591871242,
// "responseEnd": 1489591871396,
// "domLoading": 1489591871246,
// "domInteractive": 1489591871767,
// "domContentLoadedEventStart": 1489591871767,
// "domContentLoadedEventEnd": 1489591871776,
// "domComplete": 1489591872519,
// "loadEventStart": 1489591872519,
// "loadEventEnd": 1489591872519
// }

关于各个字段释义及坑点可以参考这篇文章 以及 坑点

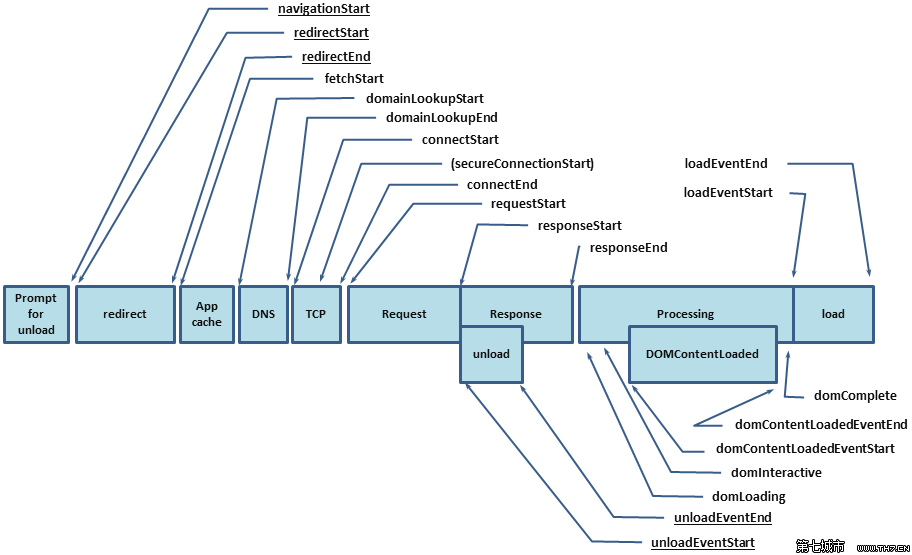
可以使用它们来统计页面的一些性能指标,比如:

  • DNS查询耗时 = domainLookupEnd - domainLookupStart

  • TCP链接耗时 = connectEnd - connectStart

  • request请求耗时 = responseEnd - responseStart (也有统计responseEnd - requestStart的)

  • 解析dom树耗时 = domComplete - domInteractive(过早获取时,domComplete有时会是0)

  • 白屏时间 = domloadng - fetchStart

  • domready时间 = domContentLoadedEventEnd - fetchStart

  • onload时间 = loadEventEnd - fetchStart (也有统计loadEventEnd - navigationStart注意:过早获取时,loadEventEnd有时会是0)

    (可能有些结果会是负数,呵呵呵呵)

    放一张时序图:

performance.timing返回的对象只定义了getter属性,如果需要改动某个属性的值,可以先调用performance.timing.toJson()
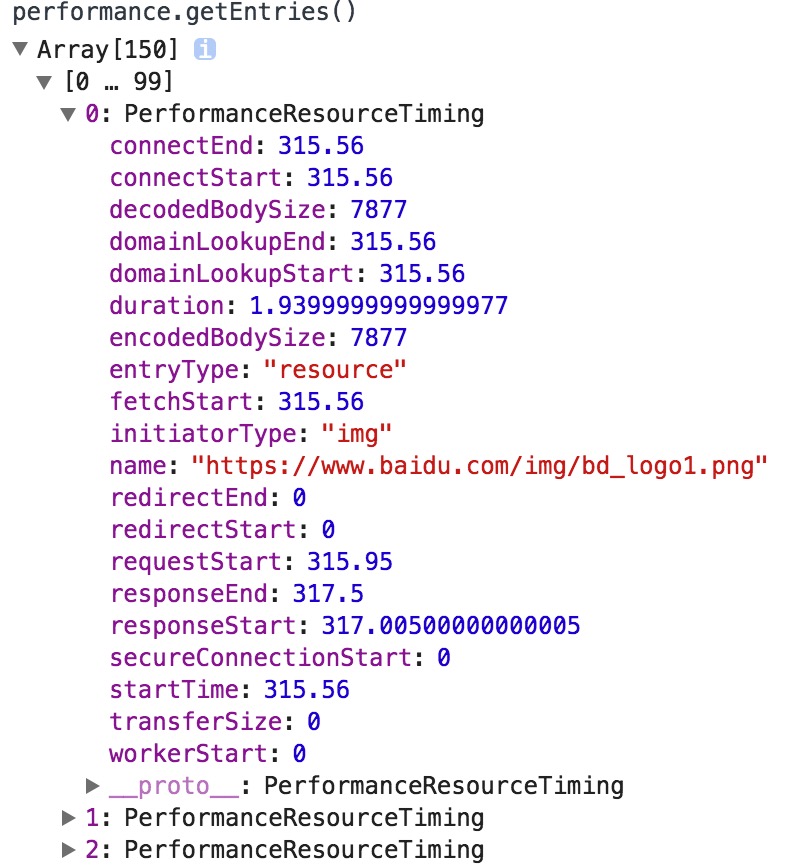
各个资源的请求时间统计

标记与测量

这个功能与console.time()、console.timeEnd()挺像。performance.mark()设置标记,performance.measure()测量两个标记之间的时间间隔,标记和测量的纪录都可以在performance.getEntries()中找到。

1
2
3
4
5
performance.mark('begin')
// dosomething()
performance.mark('end')
PerformanceMeasure('begin-to-end','begin','end')

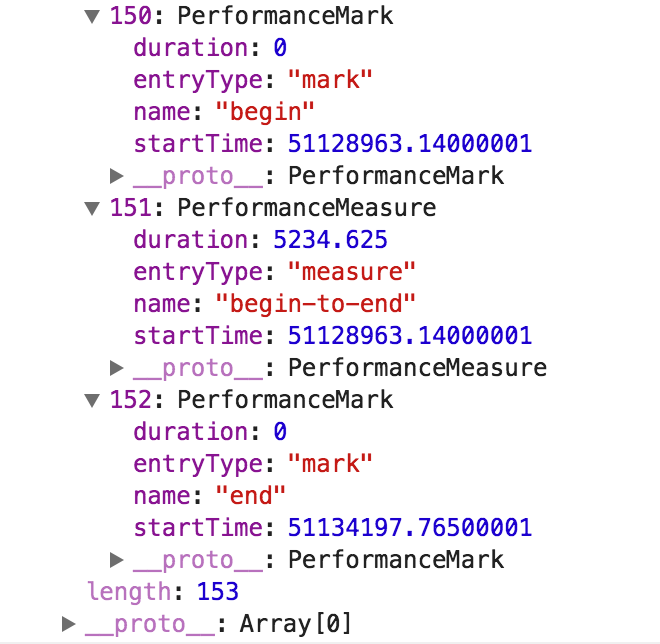
上图中的PerformanceMeasure 和 PerformanceMark 这两种纪录都有entryType和name属性,是可以通过getEntriesByType()与getEntriesByName()方法去获取的。不过这两个方法的兼容性并没有那么好。

相对时间戳

performance.now()输出的是相对于navigationStart的时间,以微秒为单位,它更精确,而且不会受系统时间的影响。

下面是new Date().getTime() 与 performance.now()的比较。

1
2
3
4
5
6
7
8
9
10
11
12
13
14
15
16
17
18
var t1 = performance.now();
while(1) {
if(performance.now() - t1 >10000) {
break;
}
}
console.log(performance.now() -t1)
// VM130:7 10000.01000000001
var t2 = new Date().getTime();
while(1) {
if(new Date().getTime() - t2 >10000) {
break;
}
}
console.log(new Date().getTime() -t2)
// VM174:7 10001

最后,MDN (https://developer.mozilla.org/en-US/docs/Web/API/Performance) 是最好的文档!!